Archive
SQL 2012 Configuration Tuning
I have been working for some time now on a very large Analysis Services 2008R2 MOLAP cube. We have been looking to upgrade this to 2012 and a few weeks before it got into production spotted some “interesting” behaviour. So thought it best to write up some of the symptoms and how to diagnose and potentially resolve.
The server itself is pretty beefy. It’s a HP DL580-G7 which has four CPU’s with 10 cores in each clocked at 2.3GHz, 512GB of memory, and some very fast Fusion IO storage (with Hyper Threading turned off, which if ON would double the number of processors and cause 2 processor groups to be created, each with 2 NUMA Nodes and each NUMA Node would have 20 processors)
I have tried to summarise below CPU layout of our HT OFF system.

Hopefully people are aware that as part of SSAS 2012, some changes were made to the thread pools, specifically of interest is new IO Processing Pool, which is now a separate pool(s) from the processing pool.
I suggest at this point you go here to have a read of a few things:
- My post on Analysis Services 2012 Configuration Settings
- My post on Analysis Services Testing Best Practices
- Wayne Robertson – Analysis Services Thread Pool Changes in SQL Server 2012
- Akshai’s presentation from SQL BITS – Performance investigations with Analysis Services 2012.
Welcome back! (if you left)
So now you can see, the changes to introduce the IO thread pool and then to actually split this into multiple subpools have been done for a couple of reasons. This is to help minimise costly cross NUMA access on the server, where accessing file data from a different CPU’s memory is an expensive operation.
I realise that I have been quite brief in the above statement, and hopefully Wayne will give more info on this in his upcoming post.
Symptoms
So it was noticed that during querying of the cube (processing was fine and VERY fast) that I saw some very high kernel/privileged time, and also some very slow query response speeds. Below find a gory picture of this in action:
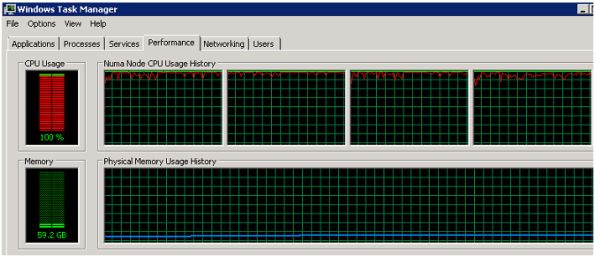
Yep, nearly wants to make you cry L
This was observed on 2012 RTM CU2. It was also noticed that as the cached got warmed less of this behaviour was observed, but as a rule of thumb I would say that we should be seeing on average less than 20% privileged time. (there is a good and basic introduction this http://www.codinghorror.com/blog/2008/01/understanding-user-and-kernel-mode.html please just read up to 2. User Mode). That figure is just my opinion, but in my experience, when things have been fast then less than 20% average was observed.
In addition to this, there has been some extensive tuning done on the configuration file for this system, for the types of queries, number of concurrent users, processing, index and aggregation builds taking into account processor layouts and last but not least the file system, which is pretty fast!
So, you will have to check all this for YOUR system for the queries and concurrency that you experience. I expect that for most SSAS cubes, the 2012 out of the box config will cope very well with most cases, but for larger cubes on multi NUMA systems, you will have to check everything is behaving well and to your expectation. This is a good investment of time as most likely the servers you are working on will have cost a LOT of money!
Diagnose
At this point if you haven’t read my post on testing mentioned earlier, it can be found here (Sorry for sending you all over the place, but hopefully it will be worth it)
As mentioned in the testing blog, you should be monitoring in perfmon at least the following counters
\LogicalDisk(*)\*
\MSOLAP$IAS01DEV2012:Memory\Memory Usage KB
\MSOLAP$IAS01DEV2012:Threads\*
\Process(msmdsrv)\% Privileged Time
\Process(msmdsrv)\% Processor Time
\Process(msmdsrv)\% User Time
\Process(*)\% Privileged Time
\Process(*)\% Processor Time
\Process(*)\% User Time
\Processor(_Total)\% Privileged Time
\Processor(_Total)\% Processor Time
\Processor(_Total)\% User Time
\System\Context Switches/sec
For your testing, you should aim to run on both a clear cache and a warm cache. A clear cache in this case means a clear Analysis Services cache and also a clear file system cache.
What you are looking for here is the proportion of “\Process(msmdsrv)\% Privileged Time” of \Process(msmdsrv)\% Processor Time, and for the test to be meaningful you need to be pushing the server so ideally the “\Process(*)\% Processor Time” should be >; 50%
Seeing a “high” proportion here means you might be experiencing the behaviour. You should also check the “\System\Context Switches/sec” if this is high also, it might also be an indicator. The other indicator will also be the actual query performance, is this in line with your expectations?
What you can do to help
Well I will start with the bad news. If you are pre SP1 then there isn’t a huge amount you can do to maintain full use of the server. You can try to affinitize the IO processing pool across the first two NUMA nodes, and you may see that there is less contention. Here is an example of this for when hyperthreading is turned OFF and we affinitize across the first two NUMA nodes.
;
;-20;
;-20;
;2;
;2;
;0;
;0x00000000000FFFFF;
;1;
;
Also change random access mode to 1
;1;
Quoting from MSDN
“Do not change this property except under the guidance of Microsoft Support. For more information, see Understanding GroupAffinity Server Properties in this topic.” Obviously, doesn’t stop you doing it, but we should follow guidelines
This got us into a position where half the server was being used for querying and processing. Pretty far from ideal, but at least it got us back to a working system.
2012 SP1
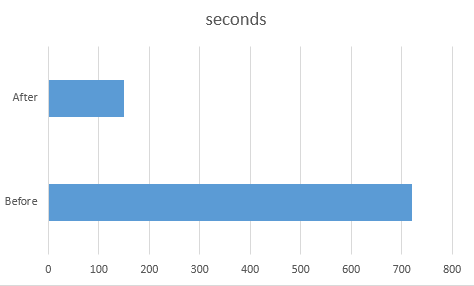
Now that SP1 is publicly available there is good news! With the correct settings we were able to get MUCH nicer behaviour and some very good query throughput as per this screenshot.

Much nicer eh!
The config we settled on was:
80 query threads
16 short/long parsing
392 processing pool threads
pernumanode -2
randomfileaccessmode 1
Affinitise across all cores
Hyper Threading OFF
Throughput for our system went from 1000 queries using 10 threads taking nearly 12 minutes on a cold cache to 2 ½ minutes on a cold cache. So you can see there, that this really can make a huge difference.
To get to this point, one by one we change the number of threads for the Query, short parsing, long parsing and IO thread pools, as well as the randomFileAccessMode and PerNumaNode settings. This generates a LOT of tests. We also tested using a variety of sets of queries, and also at different concurrency (numbers of users).
The key points here are:
- Decide on the queries for testing
- Decide on what configuration you are going to try for each test, changing ONLY ONE thing at a time.
- Decide on the number of users you are going to test with (10, 100, 1000)..
- Be VERY consistent in warm cache and cold cache tests
- Name your tests before you run them and keep all your perfmon files and test run times together.
- Possibly think about excluding the top and bottom 1% of the queries from the results to remove any random scew.
And last point for now. More threads doesn’t mean it will go faster, as you may find you will overload the server.
So hopefully this will all be of use to people. Would be happy to hear any feedback and I would be very interested to hear from people who are running SSAS 2012 with Hyper Threading ON if they found it better than HT OFF. I am sure the product team would be happy to hear this also and I will make sure to pass on.
Finally, a very big thank you for the help from the SSAS Product Team, in particular Akshai. Also, to CSS team who were part of the days and days of testing and reviewers of many xperf and perfmon traces 🙂
Chris
Management Studio Reporting wrong connection
I was recently on the wrong end of discovering a bug in Management studio this week, where the server name in the status bar and hover over tab was reporting one server, but I was actually connected to a different server.
It doesn’t seem that this is fixed yet, but I have yet to upgrade to SP1 for 2008 R2 so will update here if that does correct the problem.
Below are the steps for this as a repro.

Click “New Query” button on menu bar and AS SOON AS the new window is opening, right click.
This will bring up the context menu, where you can see

As you could see in the first screen grab. I was connected to 0019. Now I have chosen 0218

Now in that window, I run select @@servername again. And I fully expect to see 0218. Correct?

WRONG!
I see that although SSMS reports in the status bar that I am connected to 0218 as expected. I am actually connected to 0019.
Unfortunately I discovered this bug when an update was run against a production server instead of DEV (yes debate about privs in production for another day).
Jamie Thompson has here identified a good working practice on different colours for the status bar. Please note, that when i tested this, the bug reproduced above still exists.


